Welcome! Here are the website rules, as well as some tips for using this forum.
Need to contact us? Visit https://heatinghelp.com/contact-us/.
Click here to Find a Contractor in your area.
If our community has helped you, please consider making a contribution to support this website. Thanks!
Boiler Monitoring
Options

Pwall
Member Posts: 19
Ever since we had our Utica boiler installed I have been curious about some of it's issues that I have posted about on this forum in the past. Primarily short cycling. Never one to leave a question in the it feels like it stage I set about cobbling together some sensors and a script to put it into something I can visualize. Below is an image of where I am at 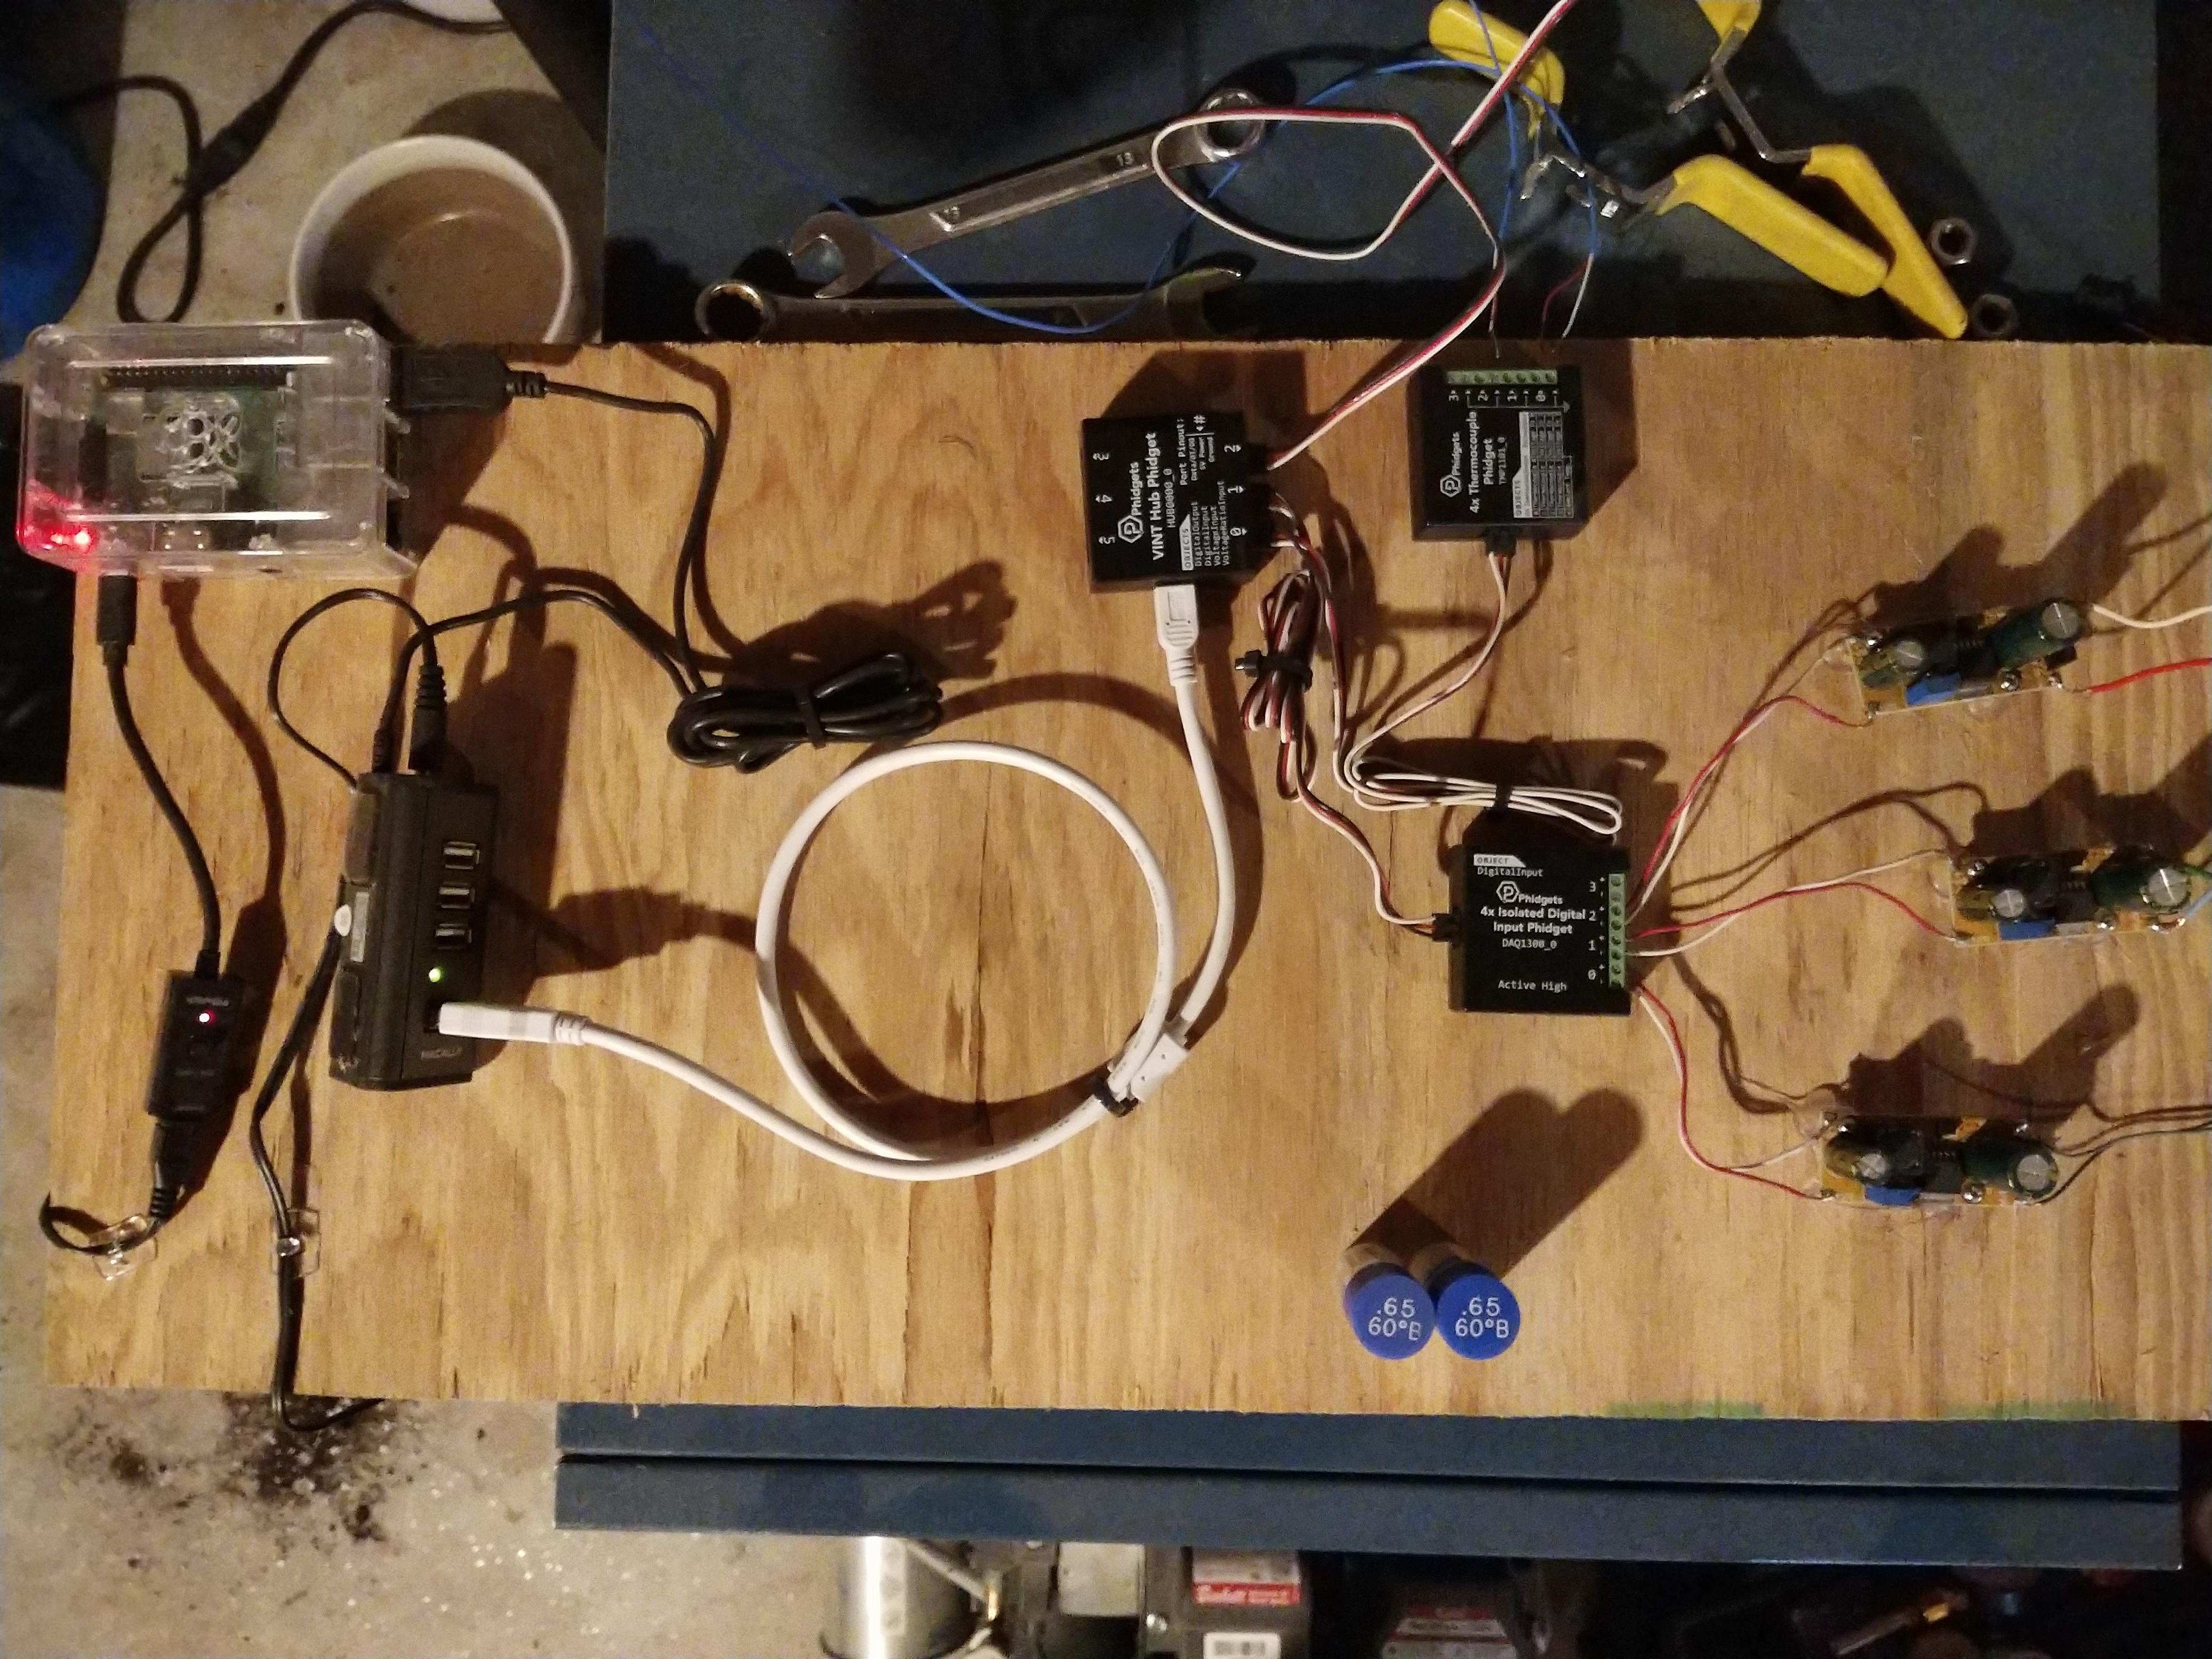
I am using sensors made by Phidgets out of Canada tied to an old 4meg Rasberry Pi 3b. There is a Vint Hub that all the sensors arrays connect to, a Thermocouple box that is reading pipe temps, an isolated Digital Input that is reading 3 buck converters.
The buck converters are wired directly to the Zone valve controller and is just sensing the voltage change to when the zone valve is energized. You have to convert from AC to DC which is what the buck converter does or the Phidget sensor sees it as turning off and on really fast due to the way AC cycles.
There is also a AC voltage detector around the line that goes to the burner to detect when the boiler is actually firing versus the zone valve being energized.
All this data is being read by a Python 2 script and being dumped into a SQLite database. I don't do any error checking in the script itself since this is just something I am doing for myself and the Phidget library has decent error handling. I also didn't do much commenting because it seems pretty straight forward to me. The code is in the next message.
I am no master programmer by any stretch of the imagination. This works for me and tells me what I want to know. I may someday add additional temp sensors for things like outdoor temps but right now it tells me what I want to know.
Your mileage will vary and there is no warranty implied or otherwise but if you have questions I will answer them the best I can.


2
Comments
-
Apparently while trying to past in the code it is removing all the formatting and it basically becomes unreadable.
import sys
import time
import datetime
import traceback
import sqlite3
from Phidget22.Devices.TemperatureSensor import *
from Phidget22.Devices.DigitalInput import *
from Phidget22.Devices.VoltageInput import *
from Phidget22.PhidgetException import *
from Phidget22.Phidget import *
def main():
temp_out = TemperatureSensor() #outbound heat
temp_in = TemperatureSensor() #inbound heat
vs = VoltageInput() #boiler
vs1 = DigitalInput() #Indirect
vs2 = DigitalInput() #1st floor
vs3 = DigitalInput() #2nd floor
temp_out.setDeviceSerialNumber(539864) #Address
temp_out.setHubPort(0)
temp_out.setChannel(0)
temp_in.setDeviceSerialNumber(539864) #Address
temp_in.setHubPort(0)
temp_in.setChannel(1)
vs.setDeviceSerialNumber(539864)
vs.setHubPort(2)
vs.setIsHubPortDevice(True)
vs1.setDeviceSerialNumber(539864)
vs1.setHubPort(1)
vs1.setChannel(0)
vs2.setDeviceSerialNumber(539864)
vs2.setHubPort(1)
vs2.setChannel(1)
vs3.setDeviceSerialNumber(539864)
vs3.setHubPort(1)
vs3.setChannel(2)
temp_out.openWaitForAttachment(5000)
temp_in.openWaitForAttachment(5000)
vs.openWaitForAttachment(5000)
vs1.openWaitForAttachment(5000)
vs2.openWaitForAttachment(5000)
vs3.openWaitForAttachment(5000)
vs.setSensorType(VoltageSensorType.SENSOR_TYPE_3500)
time.sleep(2)
boiler_run_time = 0
gallonstoday = 0.00
gallonsthisrun = 0.00
indirect_status = 0
indirect_start_time = 0
indirect_stop_time = 0
indirect_time = 0
indirect_run_time = 0
floor_1_status = 0
floor_1_start_time = 0
floor_1_stop_time = 0
floor_1_time = 0
floor_1_run_time = 0
floor_2_status = 0
floor_2_start_time = 0
floor_2_stop_time = 0
floor_2_time = 0
floor_2_run_time = 0
boiler_start_time = 0
boiler_end_time = 0
boiler_time = 0
insertdb = []
datadb = sqlite3.connect('/var/boilermonitor/boilermonitor.db')
datacur = datadb.cursor()
while True:
time.sleep(2)
tempOut=temp_out.getTemperature()
tempIn=temp_in.getTemperature()
boiler_status=vs.getVoltage()
indirect=vs1.getState()
floor_1=vs2.getState()
floor_2=vs3.getState()
while indirect==1 or floor_1==1 or floor_2==1:
if indirect==1 and indirect_status==0:
indirect_status=1
indirect_start_time=time.time()
indirect_time=time.strftime("%Y-%m-%d")
elif indirect==0 and indirect_status==1:
indirect_status=0
indirect_stop_time=time.time()
indirect_run_time=indirect_stop_time-indirect_start_time
insertdb = indirect_time, "Indirect", indirect_run_time
datacur.execute('INSERT into loads VALUES(?,?,?)', insertdb,)
datadb.commit()
elif indirect==1 and indirect_status==1:
time.sleep(2)
boiler_status=vs.getVoltage()
indirect=vs1.getState()
floor_1=vs2.getState()
floor_2=vs3.getState()
if floor_1==1 and floor_1_status==0:
floor_1_status=1
floor_1_start_time=time.time()
floor_1_time=time.strftime("%Y-%m-%d")
elif floor_1==0 and floor_1_status==1:
floor_1_status=0
floor_1_stop_time=time.time()
floor_1_run_time=floor_1_stop_time-floor_1_start_time
insertdb=floor_1_time, "1st Floor", floor_1_run_time
datacur.execute('INSERT into loads VALUES(?,?,?)', insertdb,)
datadb.commit()
elif floor_1==1 and floor_1_status==1:
time.sleep(2)
boiler_status=vs.getVoltage()
indirect=vs1.getState()
floor_1=vs2.getState()
floor_2=vs3.getState()
if floor_2==1 and floor_2_status==0:
floor_2_status=1
floor_2_start_time=time.time()
floor_2_time=time.strftime("%Y-%m-%d")
elif floor_2==0 and floor_2_status==1:
floor_2_status=0
floor_2_stop_time=time.time()
floor_2_run_time=floor_2_stop_time-floor_2_start_time
insertdb=floor_2_time, "2nd Floor", floor_2_run_time
datacur.execute('INSERT into loads VALUES(?,?,?)', insertdb,)
datadb.commit()
elif floor_2==1 and floor_2_status==1:
time.sleep(2)
boiler_status=vs.getVoltage()
indirect=vs1.getState()
floor_1=vs2.getState()
floor_2=vs3.getState()1 -
There we go. Just a matter of where I am pasting it from. This is part 2 of the code.
## check boiler status
if boiler_status>.05 and boiler_start_time==0:
## boiler is on but was off
boiler_start_time=time.time()
boiler_status=vs.getVoltage()
elif boiler_status<.05 and boiler_start_time>0:
## boiler is off but was on
boiler_end_time=time.time()
boiler_time=time.strftime("%Y-%m-%d")
boiler_run_time=boiler_end_time-boiler_start_time
gallonsthisrun=boiler_run_time/5492.31 #60*60-30/.65 gallons per second
gallonstoday=gallonstoday+gallonsthisrun
boiler_start_time=0
tempOut=temp_out.getTemperature()
tempIn=temp_in.getTemperature()
insertdb=boiler_time, boiler_run_time, gallonsthisrun, (tempOut+32*1.8), (tempIn+32*1.8)
datacur.execute('INSERT into supply VALUES(?,?,?,?,?)', insertdb,)
datadb.commit()
boiler_status=vs.getVoltage()
indirect=vs1.getState()
floor_1=vs2.getState()
floor_2=vs3.getState()
else:
if indirect==0 and indirect_status==1:
indirect_status=0
indirect_stop_time=time.time()
indirect_run_time=indirect_stop_time-indirect_start_time
insertdb=indirect_time, "Indirect", indirect_run_time
datacur.execute('INSERT into loads VALUES(?,?,?)', insertdb,)
datadb.commit()
if floor_1==0 and floor_1_status==1:
floor_1_status=0
floor_1_stop_time=time.time()
floor_1_run_time=floor_1_stop_time-floor_1_start_time
insertdb=floor_1_time, "1st Floor", floor_1_run_time
datacur.execute('INSERT into loads VALUES(?,?,?)', insertdb,)
datadb.commit()
if floor_2==0 and floor_2_status==1:
floor_2_status=0
floor_2_stop_time=time.time()
floor_2_run_time=floor_2_stop_time-floor_2_start_time
insertdb=floor_2_time, "2nd Floor", floor_2_run_time
datacur.execute('INSERT into loads VALUES(?,?,?)', insertdb,)
datadb.commit()
if boiler_status<.05 and boiler_start_time>0:
boiler_end_time=time.time()
boiler_time=time.strftime("%Y-%m-%d")
boiler_run_time=boiler_end_time-boiler_start_time
gallonsthisrun=boiler_run_time/5492.31 #60*60-30/.65 gallons per second
gallonstoday=gallonstoday+gallonsthisrun
tempOut=temp_out.getTemperature()
tempIn=temp_in.getTemperature()
insertdb=boiler_time, boiler_run_time, gallonsthisrun, (tempOut+32*1.8), (tempIn+32*1.8)
datacur.execute('INSERT into supply VALUES(?,?,?,?,?)', insertdb,)
datadb.commit()
boiler_start_time=0
continue
main()
1 -
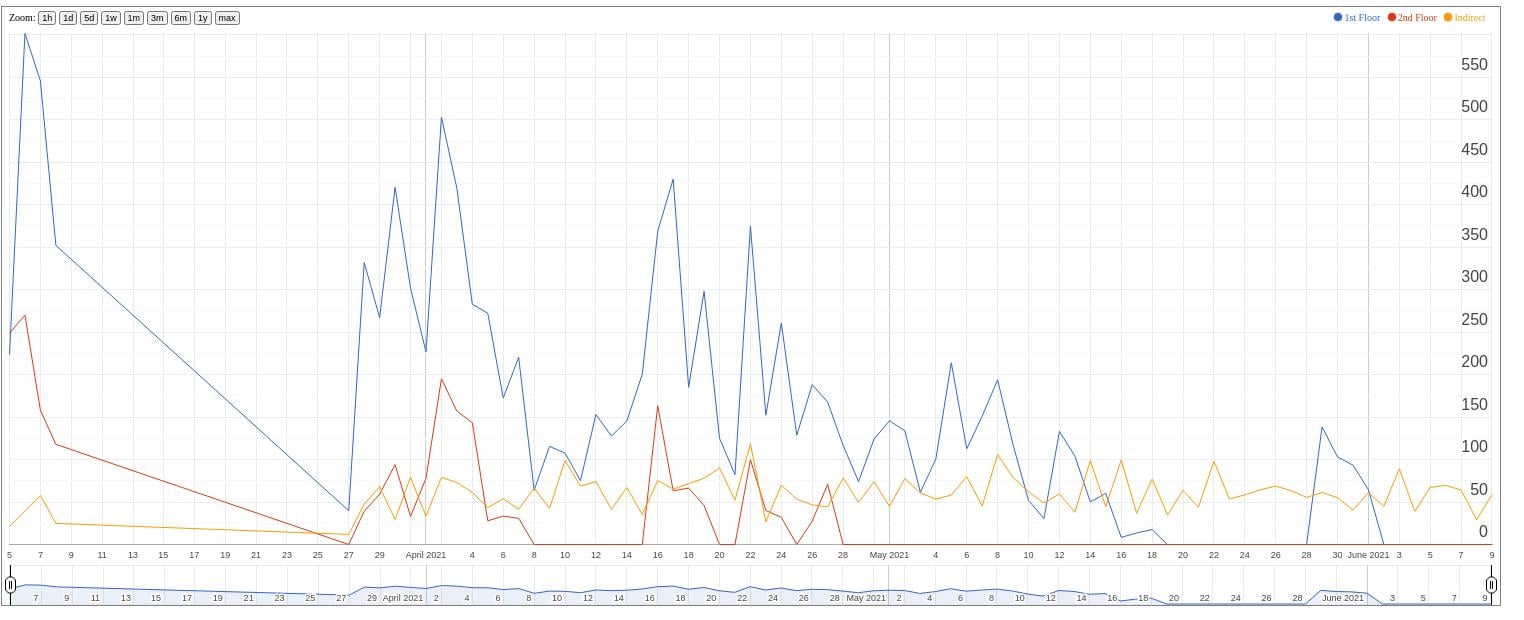
None of this is super useful unless you like to export out to CSV and import it into Excel so you can see what is happening so I put together on the same Raspberry Pi an Apache webserver with PHP and a couple of PHP scripts that use Google Charts to visualize the data. Getting Charts to work right was the hardest part. This first chart is to Visualize the loads. Who is calling for heat, when and how long. Everything is summed for the day as a whole.
<?php
$db = new SQLite3('boilermonitor.db');
$results=$db->query("select date,caller,sum(runTime) as running from loads group by date, caller");
?>
google.charts.load('current', {packages: ['annotationchart']});
google.charts.setOnLoadCallback(drawBasic);
function drawBasic() {
var data = new google.visualization.DataTable();
data.addColumn('date', 'Time of Day');
data.addColumn('number', '1st Floor');
data.addColumn('number', '2nd Floor');
data.addColumn('number', 'Indirect');
data.addRows([
<?php
$i=0;
$p=0;
$first_runtime=0;
$second_runtime=0;
$indirect_runtime=0;
while ($res = $results->fetchArray(SQLITE3_ASSOC)) {
$fixed_date=explode("-", $res['date']);
if ($res['caller']=="1st Floor" && $p==0)
{
$first_runtime=$res['running']/60;
$p=1;
continue;
}
elseif ($res['caller']=="2nd Floor" && $p==1)
{
$second_runtime=$res['running']/60;
$p=2;
continue;
}
else
{
$indirect_runtime=$res['running']/60;
$p=3;
}
if ($i>0) {
echo ", ";
}
echo "[new Date($fixed_date[0], $fixed_date[1]-1, $fixed_date[2]),$first_runtime,$second_runtime,$indirect_runtime]";
$i=1;
$p=0;
$first_runtime=0;
$second_runtime=0;
$indirect_runtime=0;
}
?>
]);
var options = {
title:'Boiler Usage',
displayAnnotations: true,
width: 1500,
height: 600,
hAxis: {
title: 'Date',
format: 'M/d/yy',
},
vAxis: {
title: 'RunTime in Minutes',
}
};
var chart = new google.visualization.AnnotationChart(document.getElementById('chart_div'));
chart.draw(data, options);
}
<?php
?>
1 -
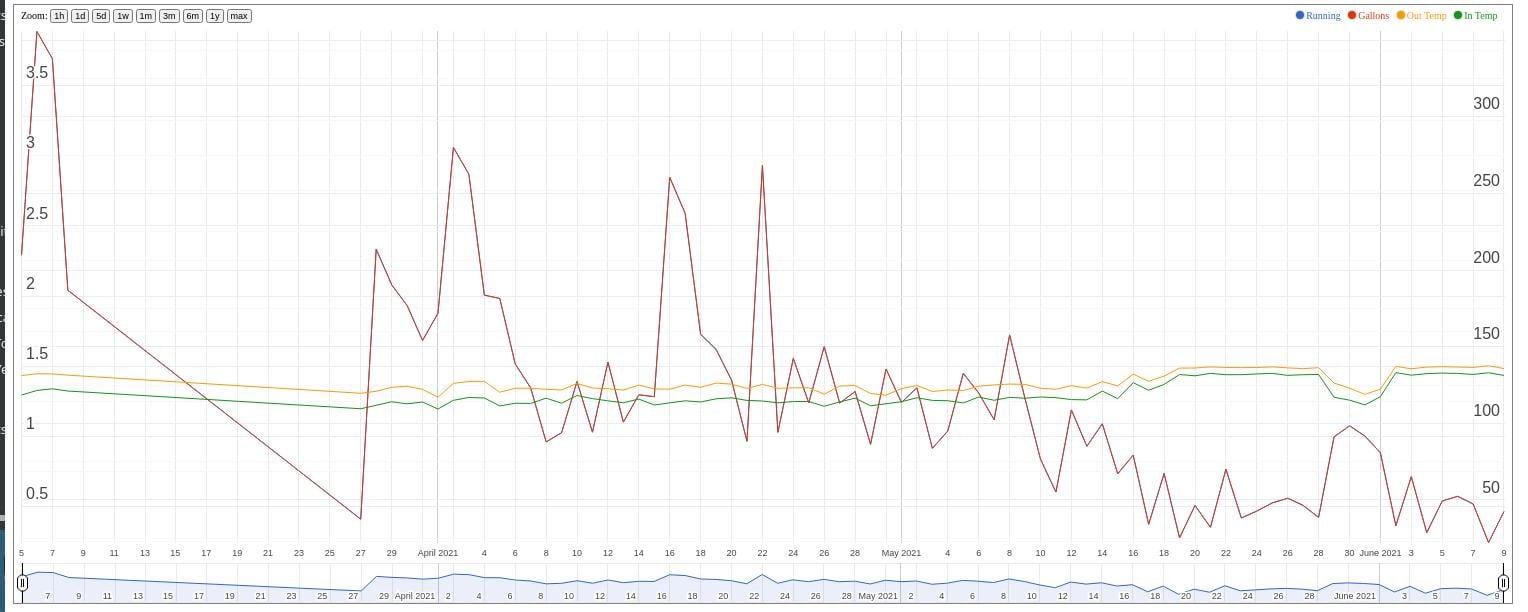
And last one is for the Supply. What is the boiler doing. How long did it run that day, approx. how many gallons of oil was used and what was the average pipe temp for the day at the end of each run cycle (not super useful).
<?php
$db = new SQLite3('boilermonitor.db');
$results=$db->query("select date,sum(runTime) as running,sum(gallons) as gallon, avg(tempOut) as outtemp, avg(tempIn) as intemp from supply group by date");
?>
google.charts.load('current', {packages: ['annotationchart']});
google.charts.setOnLoadCallback(drawBasic);
function drawBasic() {
var data = new google.visualization.DataTable();
data.addColumn('date', 'Time of Day');
data.addColumn('number', 'Running');
data.addColumn('number', 'Gallons');
data.addColumn('number', 'Out Temp');
data.addColumn('number', 'In Temp');
data.addRows([
<?php
$i=0;
while ($res = $results->fetchArray(SQLITE3_ASSOC)) {
$fixed_date=explode("-", $res['date']);
$runtime=$res['running']/60;
/*
if ($res['caller']=="1st Floor" && $p==0)
{
$first_runtime=$res['running']/60;
$p=1;
continue;
}
elseif ($res['caller']=="2nd Floor" && $p==1)
{
$second_runtime=$res['running']/60;
$p=2;
continue;
}
else
{
$indirect_runtime=$res['running']/60;
$p=3;
}
*/
if ($i>0) {
echo ", ";
}
echo "[new Date($fixed_date[0], $fixed_date[1]-1, $fixed_date[2]), $runtime, $res[gallon], $res[outtemp], $res[intemp]]";
$i=1;
}
?>
]);
var options = {
title:'Boiler Usage',
displayAnnotations: true,
displayAnnotationsFilter: true,
scaleColumns: [1,2],
scaleType: 'allmaximized',
width: 1500,
height: 600
};
var chart = new google.visualization.AnnotationChart(document.getElementById('chart_div'));
chart.draw(data, options);
}
<?php
?>
2 -
Thank you for all that -- a lot of work there. I'm sure someone will find it useful! Me? Not so much... started programming (Fortran) in 1964, didn't stop until 2007, and if I never see another computer other than the one I'm typing on and never have another gadget with a computer in it I'll be very happy!Br. Jamie, osb
Building superintendent/caretaker, 7200 sq. ft. historic house museum with dependencies in New England0 -
Pretty nice and good use of an older Pi. I'm doing something similar with the modbus on my boiler and a bunch of cheap BLE thermometers to monitor tank and manifold temps.
Rather than a local webserver, have you thought about sending the data up to cloud watch or something similar?0 -
I thought about it but I wanted to keep everything as simple as I could so as to not tax my meager programming skills or nonexistent budget to much.jad3675 said:Rather than a local webserver, have you thought about sending the data up to cloud watch or something similar?
At some point I want to add probably a third php page to look at an individual day and possibly add a field to the above scripts to show total cycles for each day.
0 -
Amazon has a free tier for cloud watch - 10 metrics. It's easy enough to do in python with boto3, too.Pwall said:Rather than a local webserver, have you thought about sending the data up to cloud watch or something similar?
I thought about it but I wanted to keep everything as simple as I could so as to not tax my meager programming skills or nonexistent budget to much. At some point I want to add probably a third php page to look at an individual day and possibly add a field to the above scripts to show total cycles for each day.
John
0 -
Cool project, any updates?0


Categories
- All Categories
- 87.7K THE MAIN WALL
- 3.3K A-C, Heat Pumps & Refrigeration
- 59 Biomass
- 430 Carbon Monoxide Awareness
- 128 Chimneys & Flues
- 2.2K Domestic Hot Water
- 5.9K Gas Heating
- 121 Geothermal
- 170 Indoor-Air Quality
- 3.8K Oil Heating
- 79 Pipe Deterioration
- 1.1K Plumbing
- 6.6K Radiant Heating
- 396 Solar
- 16K Strictly Steam
- 3.5K Thermostats and Controls
- 56 Water Quality
- 51 Industry Classes
- 51 Job Opportunities
- 17 Recall Announcements